Introduction
Data quality can be thought of as ‘fitness for purpose’ - i.e. an understanding of whether a dataset is fit for its intended uses.1 Consequently, there is really no objective definition of “quality”, rather quality is defined in relation to the requirements that are made of the data by its intended use. Quality requirements might consider different measurable characteristics of data, which are often referred to as dimensions.
The Government data quality framework lists six core data quality dimensions as:
-
Completeness: the degree to which all required data elements are present without missing values.
-
Uniqueness: the degree to which there is no duplication in records
-
Consistency: the level of harmony and conformity of data across different sources or within the same dataset: the degree of conformity across datasets or within the same dataset
-
Timeliness: a measure of how up to date the data is
-
Validity: the degree to which the data is in the expected range and format
-
Accuracy: The degree to which data values match reality and are free from errors
Assessing data quality
In a basic sense, assessing data quality means comparing the actual state of a particular dataset (or part of it) to a desired state. A ‘desired state’ might come from user or business needs and concern one of the dimensions explained above.
By clearly defining a requirement it is possible to assess whether or not the data is meeting it. Below are some examples of some different sources of requirements in the planning data service.
Data quality requirements
Data specifications
There are some very clear definitions of desired state in the form of the planning data specifications. These can be used to define field-specific requirements for datasets, like whether the data in a field is of the expected type, or whether the values are in an expected range. Quality requirements can also be based around whether or not the supplied field names match those in the specifications, or whether data is supplied in one of the required formats.
Note that the platform currently accepts and processes partial data (i.e. just some of the fields in the specs) or data which doesn’t entirely match the relevant specification.
External logic or expectation of data
More broadly than the specifications, data might also be expected to fit some other understanding of it that comes from domain experience. For example, an LPA might be expected to submit geospatial data that is contained within the boundary of their authority, or to submit a volume of data that is within a ‘normal’ range.
Operational / system behaviour
A need to understand whether the data pipeline process is behaving as expected is another source of data quality requirements. For example, it’s expected that data published on the platform should be correctly attributed to the organisation that supplied it. If it doesn’t it might indicate some mistake in processing or human error adding the data.
Strategic Programme objectives
The way that LPAs are being funded by DLUHC informs some requirements about supplying data. For example, LPAs receiving funding through the Planning Software Improvement Fund are expected to supply data for all of the pilot specifications, which relates to the completeness data quality dimension. Additionally, there may be internal business requirements relating to the accuracy or timeliness of data published on the platform.
Data consumers
Different users of the data may also have different quality requirements for it. For example, a service may require a specific set of fields from a dataset to always be present in order to be able to use the data, or another one might need to know that the data is always kept up to date.
How and where data quality assessments happen
The data processing journey covers the steps of data being collected from endpoints, changed into the required format and then collated and published on the planning data service website. Data quality assessments happen at many different stages throughout this journey and can produce different effects, from making direct changes to data values, to recording alerts that something is not as expected.
It’s important to note that the quality assessments which take place may be concerned with both validity requirements from the data specifications (e.g. is a field value in the expected format), as well as broader requirements or those which concern data maintenance or operations (e.g. are there duplicated endpoints for an organisation’s dataset). Both of these sides are essential to consider because both affect the quality of data that ends up published on the platform for consumers.
Throughout this process a number of records are produced to record what’s happened. These artefacts either:
-
Directly record the results of automated data quality assessments (and any associated transformations), or manually configured transformations made during processing
-
Or are processing logs which can be used to make further data quality assessments
These artefacts provide the input to services or tools which report on or summarise data quality:
-
Submit service
-
Config manager (data management team dashboards)
-
Data management team reporting
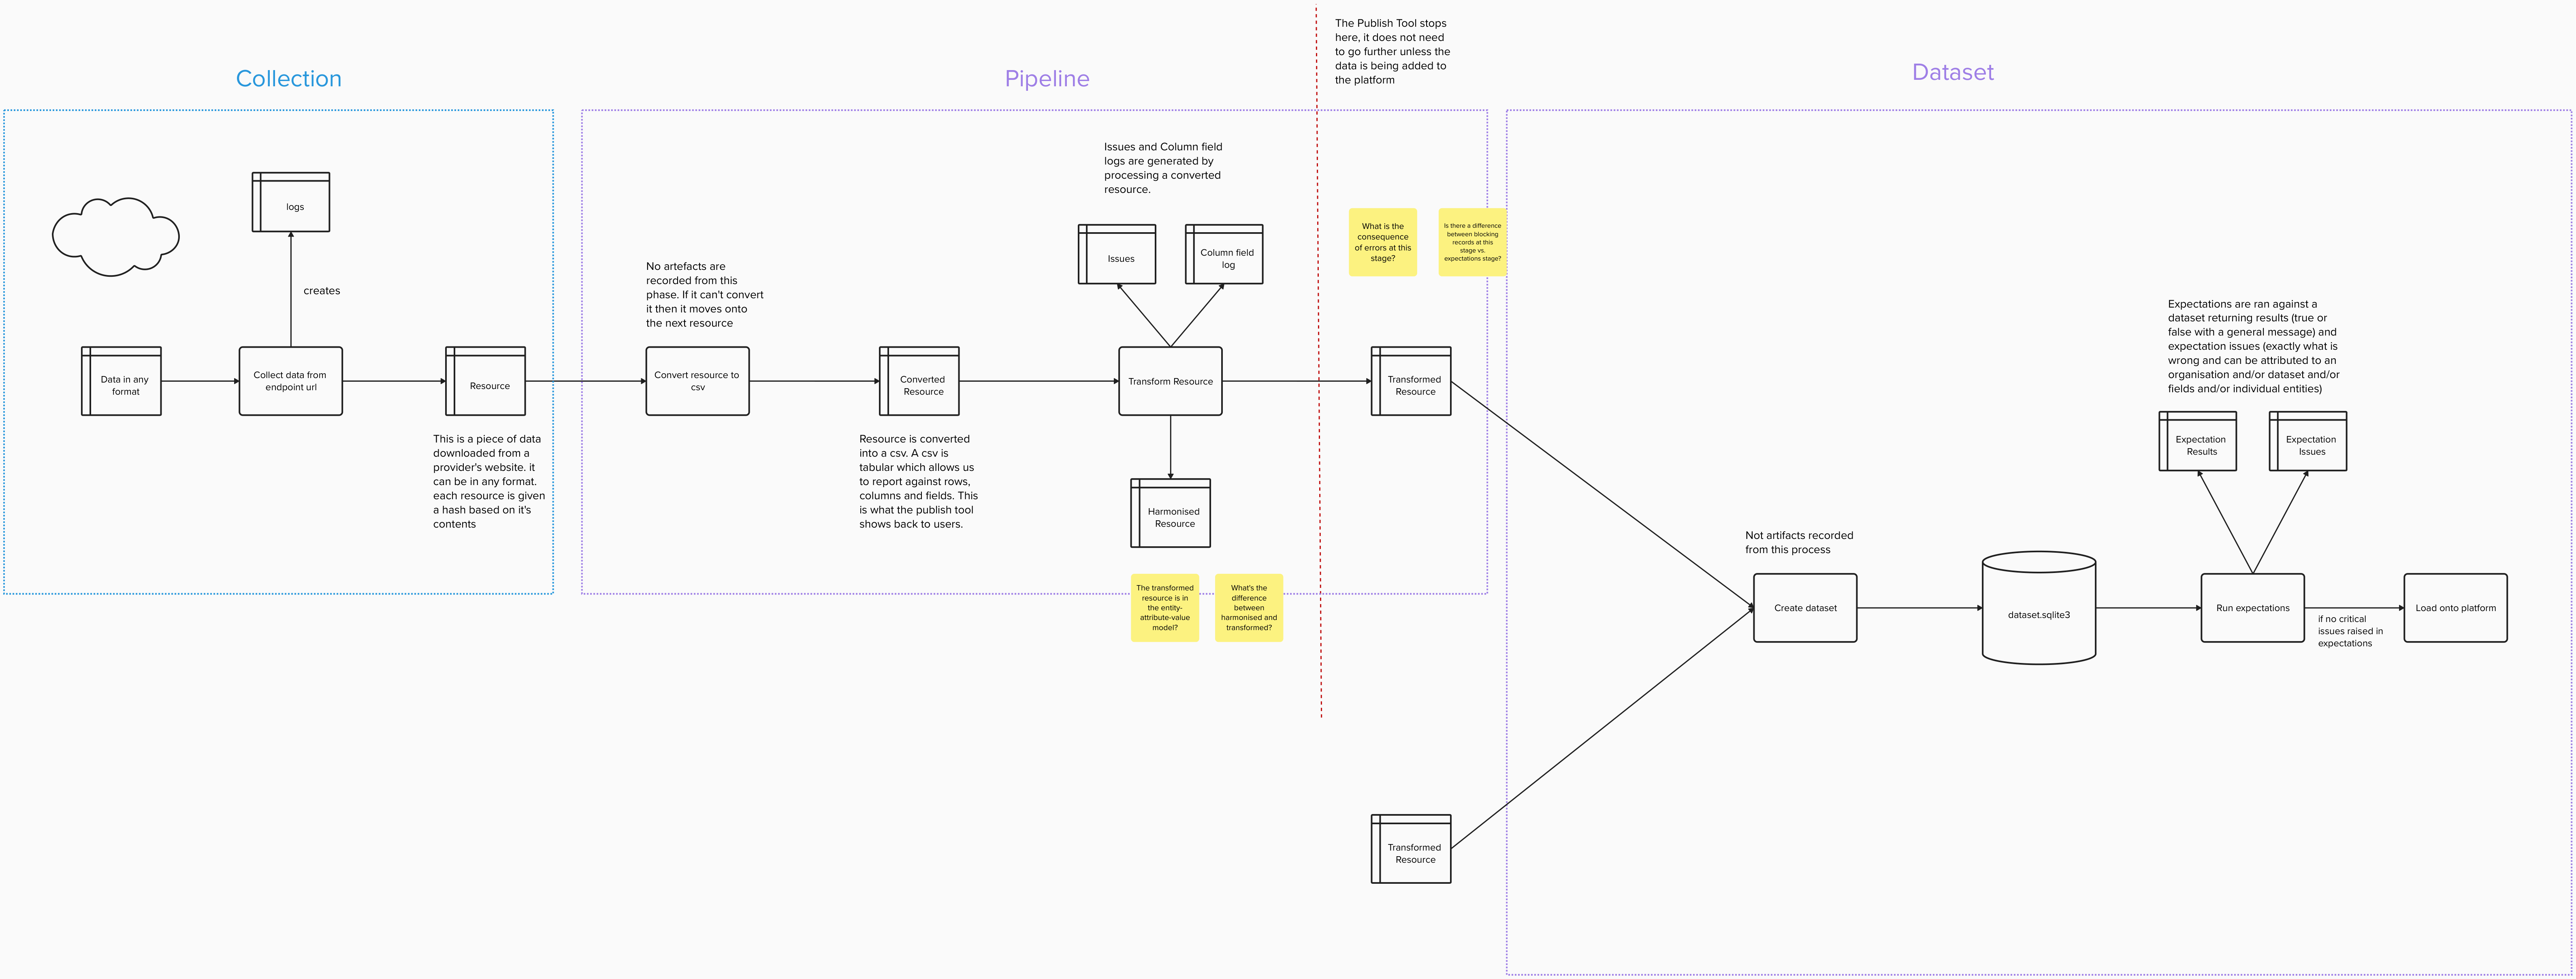
This process diagram created by Owen outlines some of the key stages in the process and where these artefacts are produced, and the next section describes some of these stages and artefacts in relation to data quality assessments.

Data collection
This is the point at which the system attempts to collect data from a data provider’s endpoint. Each unique instance of data that appears on the endpoint is known as a resource. The collection process happens daily overnight, and the results of this process are recorded in the Logs table.
Key artefact: Logs table
This table records the date of the attempt to collect data, as well as different status codes or exceptions depending on whether it was successful or not. These attempts aren’t strictly data quality assessments themselves, but the Logs can be used to make them.
Example of using the Logs table for a data quality assessment
The Logs table can be queried to check how many days it has been since an endpoint had new data published on it which might allow us to understand whether data is meeting a timeliness requirement.
Pipeline
The pipeline transforms the collected data into the format required for the platform. It is important to note here that as well as transforming the shape and format of data the pipeline can also transform data values supplied by a data provider.
The general model for assessments made here is comparing the supplied state of a value to a desired state. When the desired state is not met a data quality issue is logged. The data processing pipeline makes many such assessments automatically and in the case of common or expected data errors it may be possible to automatically transform the data to the desired state. The pipeline also allows for the configuration of dataset, endpoint, or resource-specific processing to handle problems which have been identified manually.
Example of automated assessment:
The values for the point field in a tree dataset is supplied in the OSGB36 coordinate reference system, rather than the WGS84 required by the specification. The point value is automatically re-projected to WGS84, and a data quality issue is created to record this.
Example of manual configuration:
When adding a new endpoint for the listed-building-outline dataset it’s noticed that the listed-building-grade field contains the values 1, 2, and 3 rather than the I, II, and III required by the specification. These supplied values are mapped to the desired values by making an addition to the patch.csv file in the listed-building collection configuration, and a data quality issue is automatically created during processing to record this re-mapping.
See our how to configure an endpoint guide for more information on configuration.
The severity level of the data quality issue which is logged during this process indicates whether a transformation was successfully made to the desired state (severity level = “informational” or “warning”), or whether this was not possible (severity level = “error”).
Key artefact: Issue_type table
This table lists the types of issues that can be automatically detected at this processing stage. Some of the issue types are used indicate where data has been transformed, either due to manual configuration or automated error-handling, while others record an error that could not be handled.
Key artefact: Issue table
This table records the issues that have been identified during this processing stage, using the issue_type field to flag the quality issue that was detected for any value.
Key artefact: Column_field table
This table records how the field names in any supplied resource have been mapped to the dataset field names. Note - the field names for a dataset includes the specification field names plus those which are generated by the pipeline such as organisation and entity.
Dataset
At this stage transformed resources from data providers are combined into database files and loaded onto the platform. Once the database files have been created there is a further opportunity to make data quality assessments which make use of an entire dataset or datasets, rather than just being able to examine data row-by-row. Assessments made at this stage of the process vary from the pipeline stage in that they do not alter the data and simply report data quality issues.
Example Dataset quality assessment
Having access to the whole dataset makes it possible to assess things like whether the values in a reference field are unique, or whether the reference values used across conservation-area and conservation-area-document datasets link correctly.
Key artefact: Expectation issues table
Key artefact: Expectation results table
Monitoring data quality
In order to structure how the artefacts described above are used for monitoring, the data management team have built and maintain a list of data quality requirements.
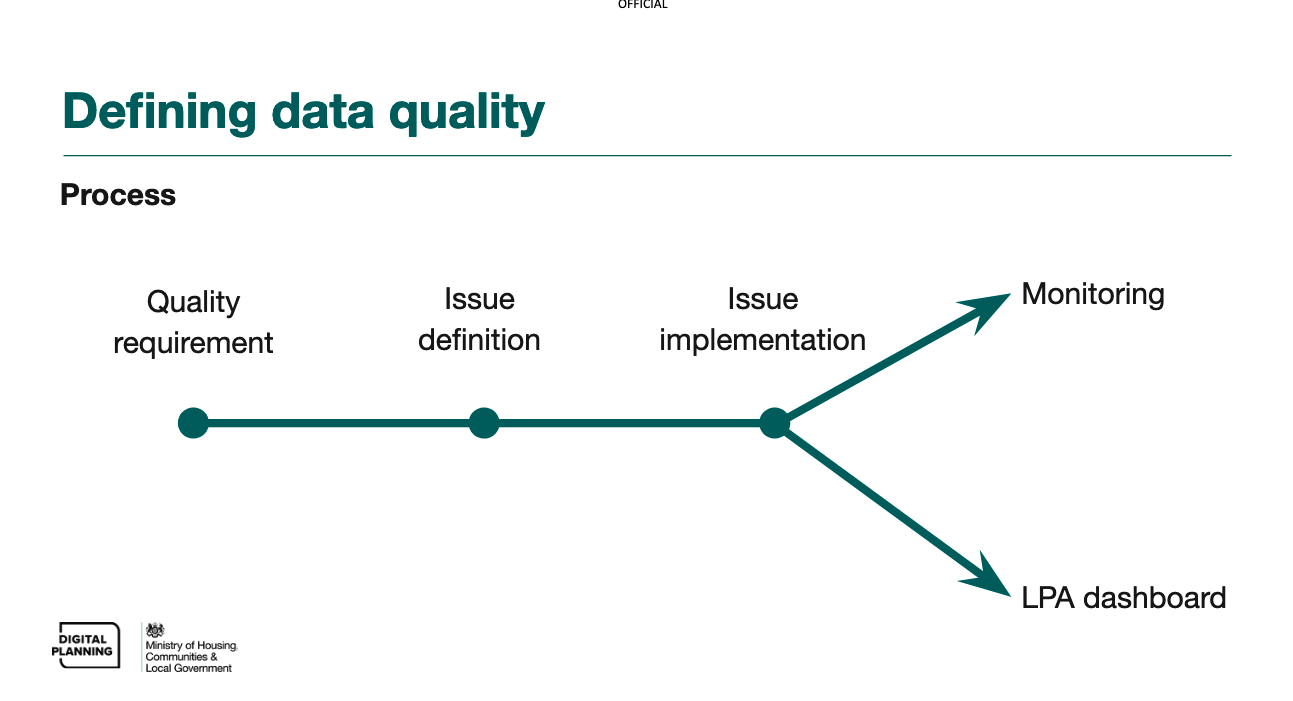
These documented data quality requirements help the data management team understand what needs to be assessed, why it needs to be assessed, and plan how it can be assessed. We use the process below to go from identifying a data quality need through to being able to actively monitor whether or not it is being met.

-
Quality requirement: documenting a need we have of planning data based on its intended uses.
-
Issue definition: agreeing the methods for systematically identify data which is not meeting a quality requirement.
-
Issue implementation: automating identification of issues, either through a query or report, or through changes to the pipeline.
-
Issue use (monitoring): surfacing information about data quality issues in a structured way so that action can be taken.
Once the issue is defined and operational, the monitoring can be carried out in one of two ways, depending on the type of issue.
-
By the Publish service, to allow LPAs to self-monitor and fix issues at source
-
By the Data Management team, to resolve data quality issues that can be fixed by a change in configuration
Note: The Data Management team also has a defined process for resolving data quality issues, which begins with an investigation, followed by one or both of a data fix and root cause resolution.
Measuring data quality
With well defined data quality requirements and issues, it’s possible to use them to make useful summaries of data quality at different scales, for example assessing whether the data on a particular endpoint meets all of the requirements for a particular purpose.
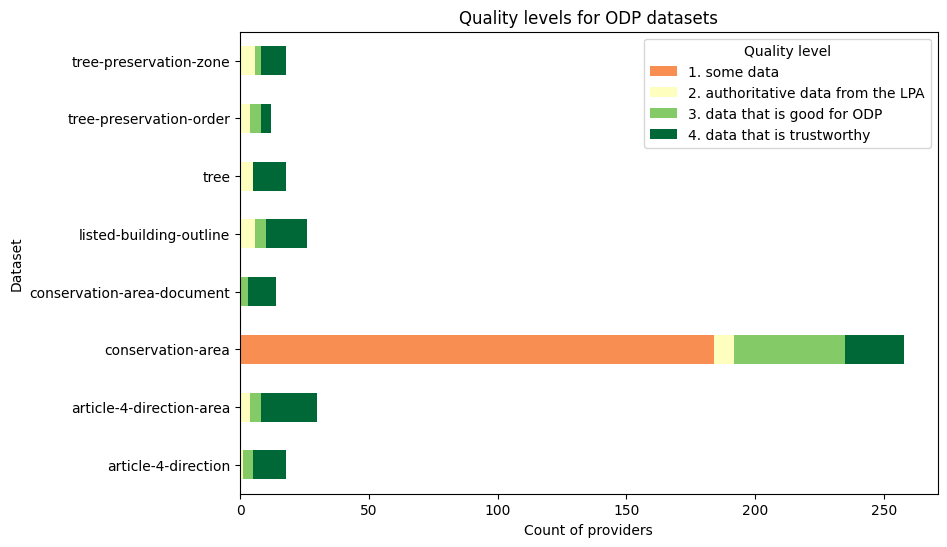
We’ve created a data quality measurement framework to define different data quality levels based on the requirements of ODP software. This measurement framework is used to score data provisions (a dataset from a provider) and create summaries of the number of provisions at each quality level.
The table below visualises the framework:

The criteria marked as “true” at each level must be met by a data provision in order for it to be scored at that level. Therefore the framework defines 5 criteria that must be met in order for a data provision to be good for ODP. The levels are cumulative, so those same 5 criteria plus 3 more must be met in order for a provision to be scored as data that is trustworthy. Where we have data from alternative providers (e.g. Historic England conservation-area data) the first criteria cannot be met so it is scored as the first quality level, some data.
Each of the criteria are based around one or more data quality requirements. For example, the “No other types of validity errors” criteria is based on meeting 7 different data validity requirements from the specifications, while the “No unknown entities” criteria is based on just one timeliness requirement. We track how requirements are mapped to criteria on the measurement tab of the data quality requirements tracker.
The framework is flexible and allows us to add more criteria to each level, or re-order them as required. Note that the criteria marked as “planned” are in development, and will be able to be used in the measurement framework once live.
The chart below is an example of using the framework to measure the quality levels across all ODP dataset provisions (on 2024-11-20):

(see quality reporting in the jupyter-analysis repo for up to date versions)