Data Quality Framework
We have a structured approach to how we identify and fix issues with data quality, which we refer to as our data quality framework.
A key part of this framework is a list of data quality requirements built and maintained by the data management team.
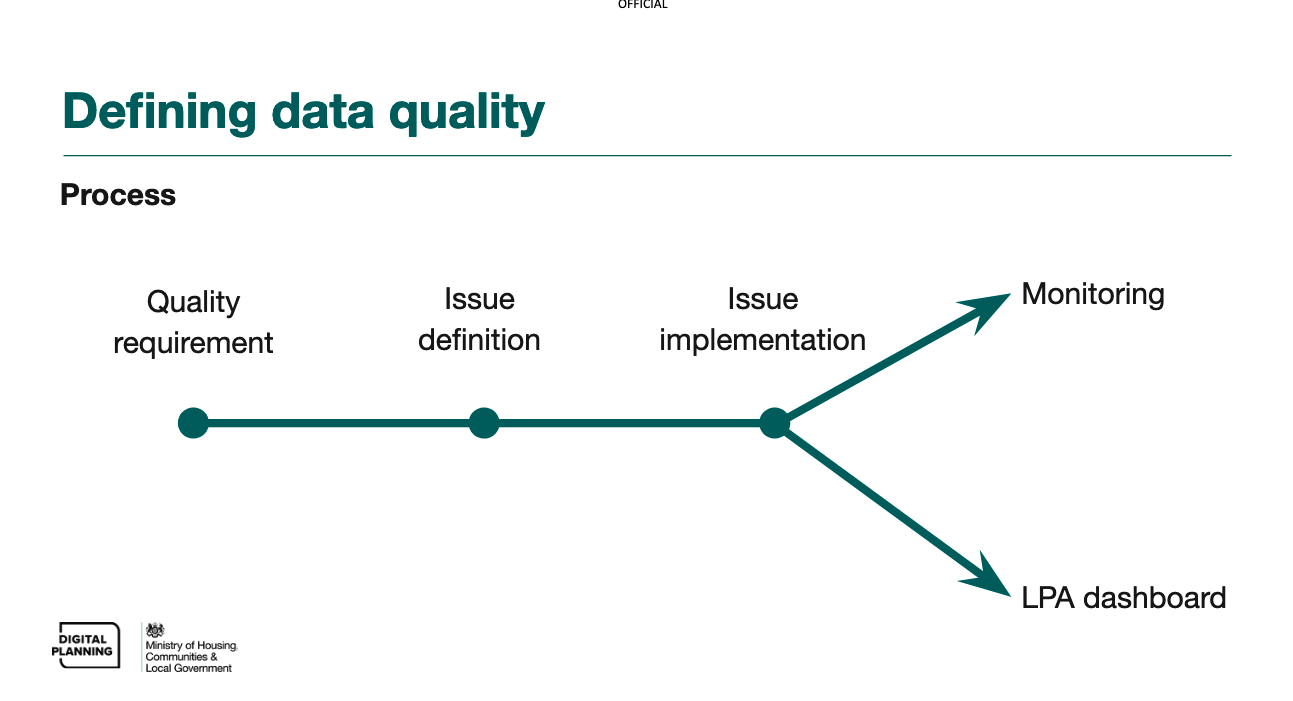
These documented data quality requirements help the data management team understand what needs to be assessed, why it needs to be assessed, and plan how it can be assessed. We use the process below to go from identifying a data quality need through to being able to actively monitor whether or not it is being met, and then raise the issues to the party responsible for fixing them.
-
Quality requirement: documenting a need we have of planning data based on its intended uses.
-
Issue definition: agreeing the method for systematically identifying data which is not meeting a quality requirement.
-
Issue check implementation: automating identification of issues, either through a query or report, or through changes to the pipeline code.
-
Issue check use (monitoring): surfacing information about data quality issues in a structured way so that action can be taken.
Example
Here’s an example using a requirement we have based on the expectation that providers of our ODP datasets should only be providing data within their local planning authority boundary. This helps us identify a quality issue like if Bristol City Council were to supply conservation-area data where a polygon was in Newcastle.
- Quality requirement: geometry data should be within the expected boundary of the provider’s administrative area
- Issue definition: An ‘out of expected LPA bounds’ issue for ODP datasets is when the supplied geometry does not intersect at all with the provider’s Local Planning Authority boundary
- Issue check implementation: expectation rules which test for any of these issues on all ODP datasets.
- Issue check use (monitoring): surfacing information about out of bounds issues in the Submit service so that LPAs can act on this and fix the issues.
Monitoring data quality
Once data quality issues are defined, and checks for them have been implemented, we’re able to systematically monitor for any occurances of data quality issues.
Monitoring is carried out in one of two ways, depending on whether the responsibility for fixing the issue is external (i.e. with the data provider) or internal (i.e. with the data management team):
- By the Check and Provide service, to allow LPAs to self-monitor and fix issues at source
- By the Data Management team, to resolve data quality issues that can be fixed by a change in configuration
See our monitoring data quality page which gives guidance on the processes we follow to fix quality issues raised by our operational monitoring. These processes go hand-in-hand with our data quality requirements, which defines our full backlog of requirements, issue definitions and monitoring approach.
Note: The Data Management team also has a defined process for tackling ad-hoc data quality issues which are raised for data on the platform. This begins with an investigation, followed by one or both of a data fix and root cause resolution. This process may also result in the formal definition of a data quality requirement and issue check so that it can be handled in future through the data quality management framework.
Measuring data quality
With well defined data quality requirements and issues, it’s possible to use them to make useful summaries of data quality at different scales, for example assessing whether the data on a particular endpoint meets all of the requirements for a particular purpose.
We’ve created a data quality measurement framework to score data provisions (a dataset from a provider) on a 0-6 scale and create summaries of the number of provisions at each quality level. The framework is applied slightly differently depending on a dataset’s scope:
- ODP datasets — the 8 datasets used by Open Digital Planning software
- Mandated datasets — datasets LPAs are statutorily required to provide, or specifically encouraged to provide in their role as a local planning authority
- Single-source datasets — all other datasets
The model: authoritative status crossed with data quality
Each provision is scored on two things:
- Authoritative — whether the data is confirmed to actually come from the authoritative source for that dataset, rather than an alternative provider
- Data quality — how good the data itself is: severe issues present, only minor validity/consistency issues, or no issues at all
Crossing these two gives six levels (plus 0 for no data at all):
| Level | Label | Description |
|---|---|---|
| 0 | no data | Data is missing |
| 1 | some data | Contains data from an alternative source |
| 2 | indicative data | Data from alternative sources suitable for informing indicative decisions |
| 3 | verifiable data | Data which verifiably matches material information |
| 4 | authoritative data | Contains some data from authoritative sources |
| 5 | usable data | Contains authoritative data suitable for informing administrative decisions |
| 6 | trustworthy data | Authoritative data which cites and matches material sources of information |
Authoritative status determines which half of the scale a provision sits in: 1-3 for non-authoritative provisions, 4-6 for authoritative ones. Importantly, this is not a hard cap on the rest of the score — a non-authoritative provision can still independently reach verifiable (level 3) if its data quality is otherwise clean. Authoritative status only ever determines which half a provision sits in, not whether it can reach the top of its half.
Within each half, the specific level is set by the most severe issue found on the provision: an error (e.g. an invalid date) scores the bottom of the half (1 or 4); a warning (e.g. flipping the X and Y coordinates) scores the middle (2 or 5); and no errors or warnings scores the top of the half (3 or 6). In the future, we will also create notice tasks for some issues, but these are for visibility only and explicitly don’t affect the quality score. This is our current thinking on where to draw the line between severity levels, and it may become more nuanced as the framework develops.
Determining authoritative status
Rather than inferring provenance indirectly (e.g. via a geospatial check against a provider’s boundary), authoritative status is read directly from a signal the platform already computes: every dataset’s own entity table carries a quality value per entity, which in practice is set to either authoritative or some. A provision counts as authoritative if any of its entities are authoritative.
This is a more reliable check than inferring provenance from geography, because a provider can be registered as the expected authoritative source for a dataset while some or all of the actual data held for their area still comes from an alternative provider — the entity-level quality field reflects what was actually submitted, not just who’s nominally responsible for it.
Overrides
Two situations override the score entirely:
- Zero entities: if a provision has an active endpoint but produced zero actual entities (e.g. every submitted row failed processing), it’s scored
0. no dataoutright — there’s nothing meaningful for the data quality or authoritative axes to assess. - Staleness (single-source datasets only): a provision whose endpoint hasn’t been refreshed in over a year is capped out of trustworthy down to usable. This only applies to single-source datasets, since ODP and mandated datasets already have other quality signals to lean on, and staleness only acts as a ceiling — it doesn’t push an already-lower score down any further.
Mapping criteria to requirements
Each dataset provision’s quality level is determined by two things:
- whether the data comes from an authoritative source, based on the entity-level quality signal described above
- the most severe outstanding task for that provision in the task table, excluding authoritativeness tasks
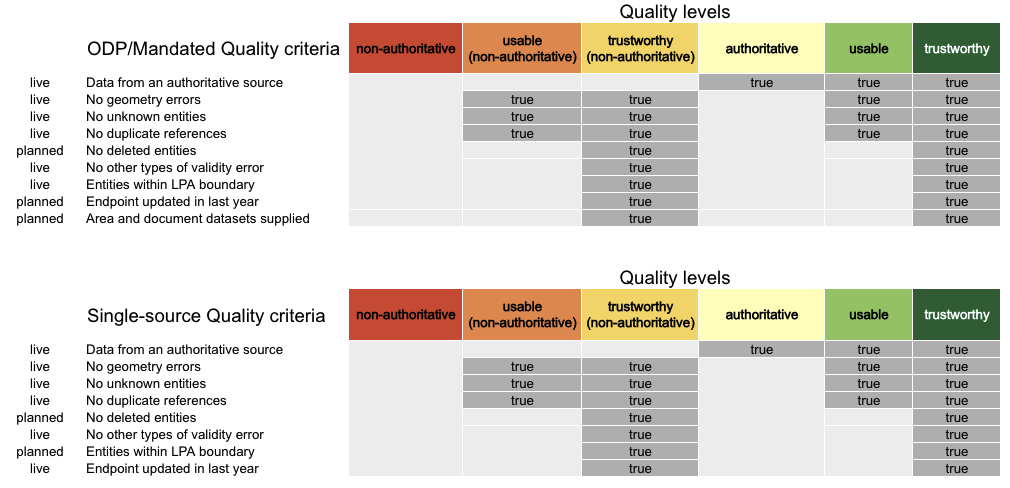
The task table brings together everything that can raise a task: issues found when processing resources, expectation checks across the dataset, endpoint collection failures, and provision checks. Each task has a severity of critical, error, warning or notice.
The tests and expectations that raise these tasks, and the severity each one is given, are listed on the measurement tab of the data quality requirements tracker.
As requirements evolve, we can add checks or change their severity without changing the structure of the framework.
Future work
The scoring described above only applies at the provision level. We’re planning to extend quality scoring to three further levels of the data model, each scored independently but built from the layer beneath it:
- Fact — a single value, for a single field, on a single entity, from a single source
- Entity — a real-world thing (e.g. a single brownfield land site), built from one or more facts
- Dataset — the full national collection for a dataset (e.g. all brownfield land), built from every provision within it
We’ve also agreed to split how quality is surfaced depending on who’s responsible for acting on it:
- Internally, quality information will be surfaced on our own Power BI dashboards, for issues the data management team needs to fix
- Externally, quality information will be surfaced to LPAs via the Check and Provide platform, for issues they need to fix in their own data
This work hasn’t started yet — the design is still being worked through, including exactly how each level’s score should be calculated and which checks should gate which tiers.